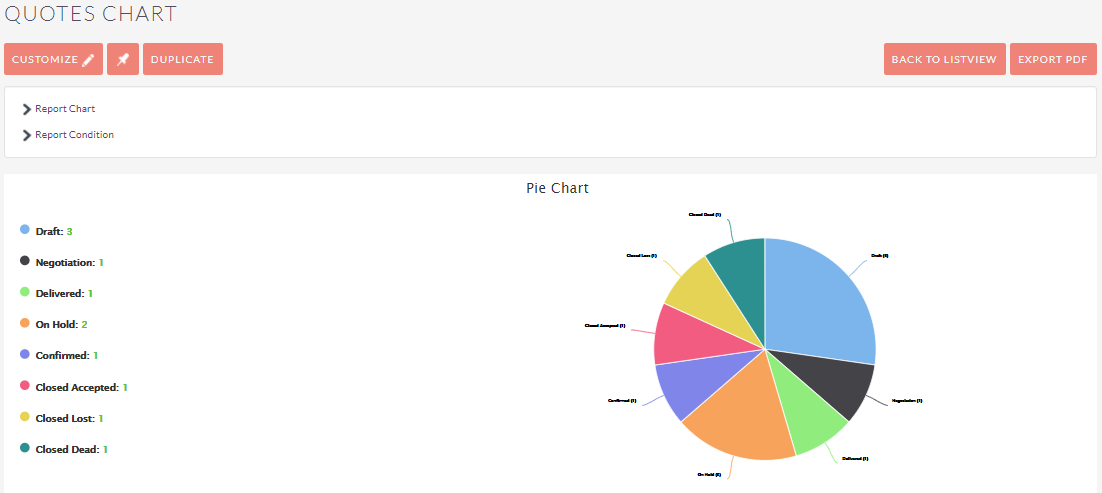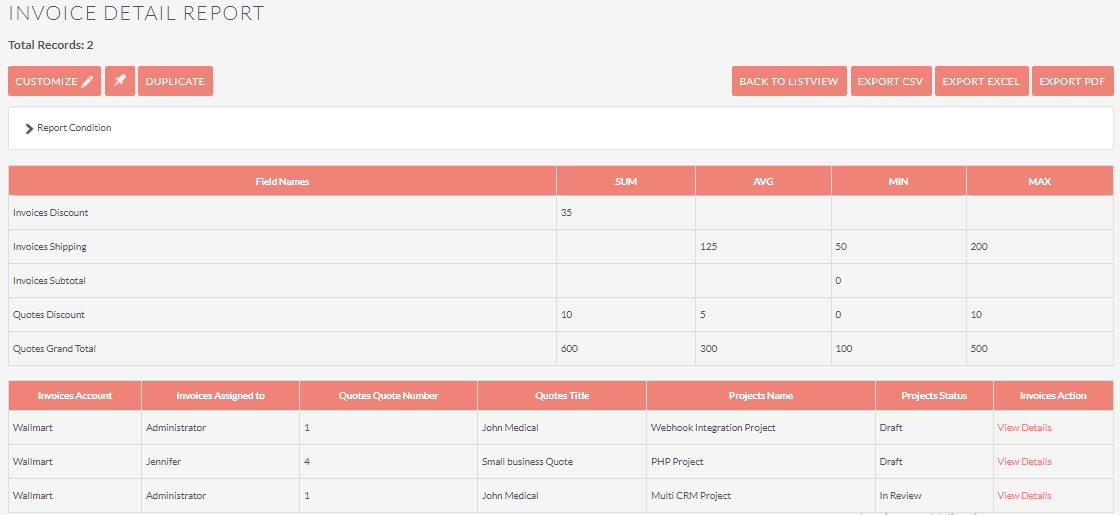
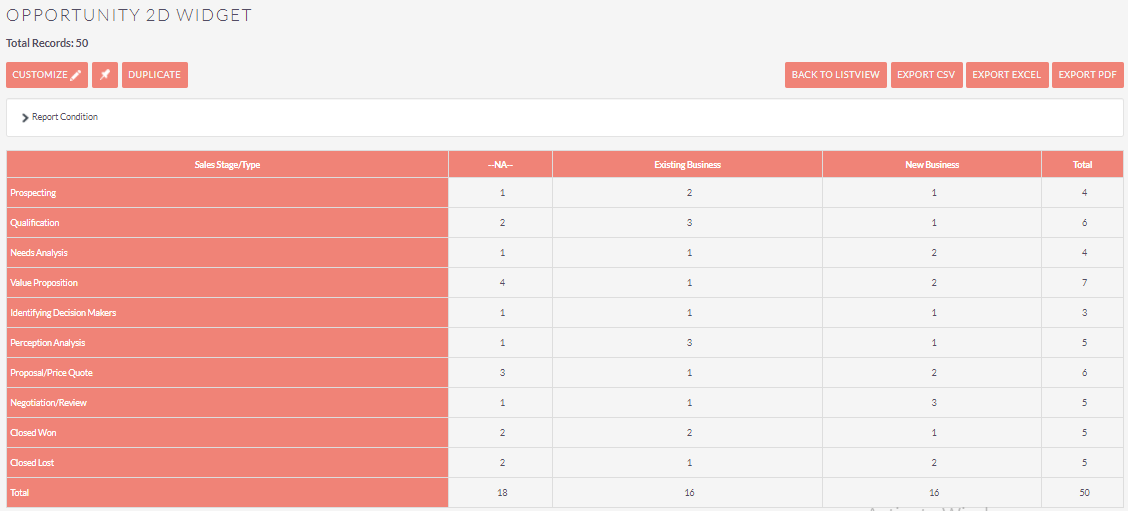
Report & dashboard is a SuiteCRM extension that gives options to view Reports on dashboard with applied condition & able to view the report from module listview sidebar action. It also allows you to generate Chart, Detail and 2D Widget reports from the configuration page of report and dashboard module.
Features:
- The report has been generated for the Module sidebar for that particular module.
- Check records by selecting folders of their choice.
- Visible on the dashboard by selecting Default or Custom Tab.
- Reports available in Chart, Detail, or 2D Widget.
- Reports can be generated in multiple chart types.
- Exported Report as PDF, Excel, or CSV File.
- View/Hide the report on Dashboard.
Appshor has Introduced SuiteCRM Report And Dashboard manage three types of Reports(Chart Report, Detail Report and 2D Widget Report) for a particular module field.
It is obvious that you want to display quick results of the search field by generating Reports(Chart Report, Detail Report and 2D Widget Report) for all module fields. Sometimes we require generating Reports for all module fields more than what is provided by SuiteCRM.
If we want to Generate Reports(Chart Report, Detail Report and 2D Widget Report) for a particular module/module’s field then we can not manage it in all module fields and we can not display that Report on Module’s Sidebar Action and default/custom Tab of Dashboard. Also not able to display Reports on Module’s Sidebar Action and default/custom Tab of Dashboard for Non Admin User.
Appshor Introduce Report And Dashboard Plugin:
Our Aim was to fulfill the needs of all the businesses looking to run complicated, but easy to read reports.
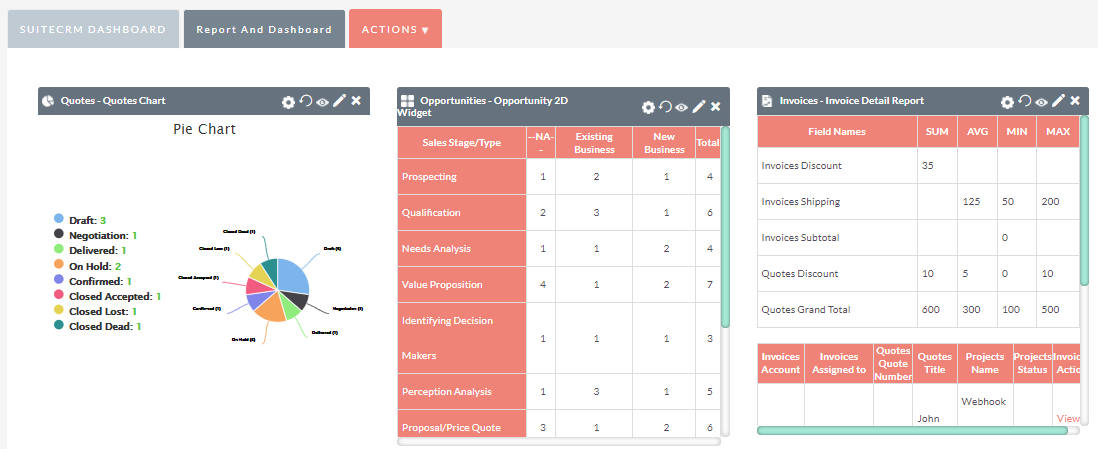
Report And Dashboard Includes the 3 level Detail Report, 2D Widget Report and Chart Report(Pie/Bar(Column)/Line/Stacked Bar/Stacked Column/Funnel/Donut/Pyramid/Column Pyramid/stacked Bar Pyramid/stacked Column Pyramid/Cylinder chart).
All the charts and reports can be placed on the module’s sideBar Action and dashboard for quick & easy access.
Report And Dashboard Includes many unique features like Drag & Drop reports on Dashboard, Scheduled report, Export report as a pdf/Excel/CSV, sharing report, all chart Dimensions such as Legend Position, Legend Value, Display Label, Display Grid, Format Large Number, Draw Horizontal Line and sorting fields.
For example: If you’re a Product based company and you want to show how many product sales in a specified year or find particular product value such as minimum, maximum, average of product amount, sum of all products amount, you can manage such requirements using the Chart Report of Report & Dashboard extension.
Detail Report:
If you want to show a Detail Report of any hierarchy of module/Product, display product amount using some operation, you can manage such requirements using the Detail Report of Report & Dashboard extension.
2D Widget Report:
If you want to show a 2D Widget Report of how many products exist between some amount range, how many product sales between specified years, you can manage such requirements using the 2D widget Report of Report & Dashboard extension.
If you want to show Reports on Module’s sidebar Action and Dashboard, you can manage such requirements using the Report & Dashboard extension.
Check out Demo of SuiteCRM Report & Dashboard Plugin and Watch Video
Try all extensions under one pack with each installation. Simply Register With Us and start using it.
So simple !!! Right?
Stay tuned to have this uploaded to our extensions store.
Hope you found this blog useful.
SuiteCRM is the best for your business requirement. Appshor provides you 14 Days Free Tour of SuiteCRM Report & Dashboard extension along with 30+ all in one pack with installation at $99 / Month.
Please contact us on info@appshor.com if you needed further help from us.
Let us know if you needs more information on this
Do You Need More Information ?
For any further information / query regarding Technology, please email us at info@appshor.com
OR call us on +91 94080 58808, Alternately you can request for information by filling up Contact Us

